Relatable Impact!
The outcomes of a Data Science project require impactful communication to the audience. For this project, I considered global crises that effected large populations.
You can watch this 5min YouTube video for a short summary.
Principles
Global crises can be made more relatable by understanding the
Psychological Distance inducing lack of
relatability.
Psychological distance refers to how far away something feels in your mind. It's not about physical distance, but more about how close or far things seem in time, space, or even emotionally. For example, something happening far away might feel less important to you than something happening nearby. It's all about how we see things in our minds, whether they feel close or far, even if they're not physically distant.
For the case studies I take, I reduce psychological distance using
- Space
- Time
- Reality
I also use the concept of the "extra mile", which uses two principles:
- Contrasting Clarity: When you want to show how bad something is, you emphasize its impact with something even worse.
- Relative Deprivation: When you feel like things are really bad because you compare them to how they used to be.
Case Studies
It can seem daunting to visualize so many datapoints, or to even find the landcover for
your required population count. I personally went an extra mile, and
created two libraries which you can call to
optimally find desired
region-of-interest.
The added advantage of using this library is that you can play around with the widget in your jupyter notebook, all you have to do is grant Google Earth Engine permissions to your google cloud platform so that it can render your desired results.
SPACE
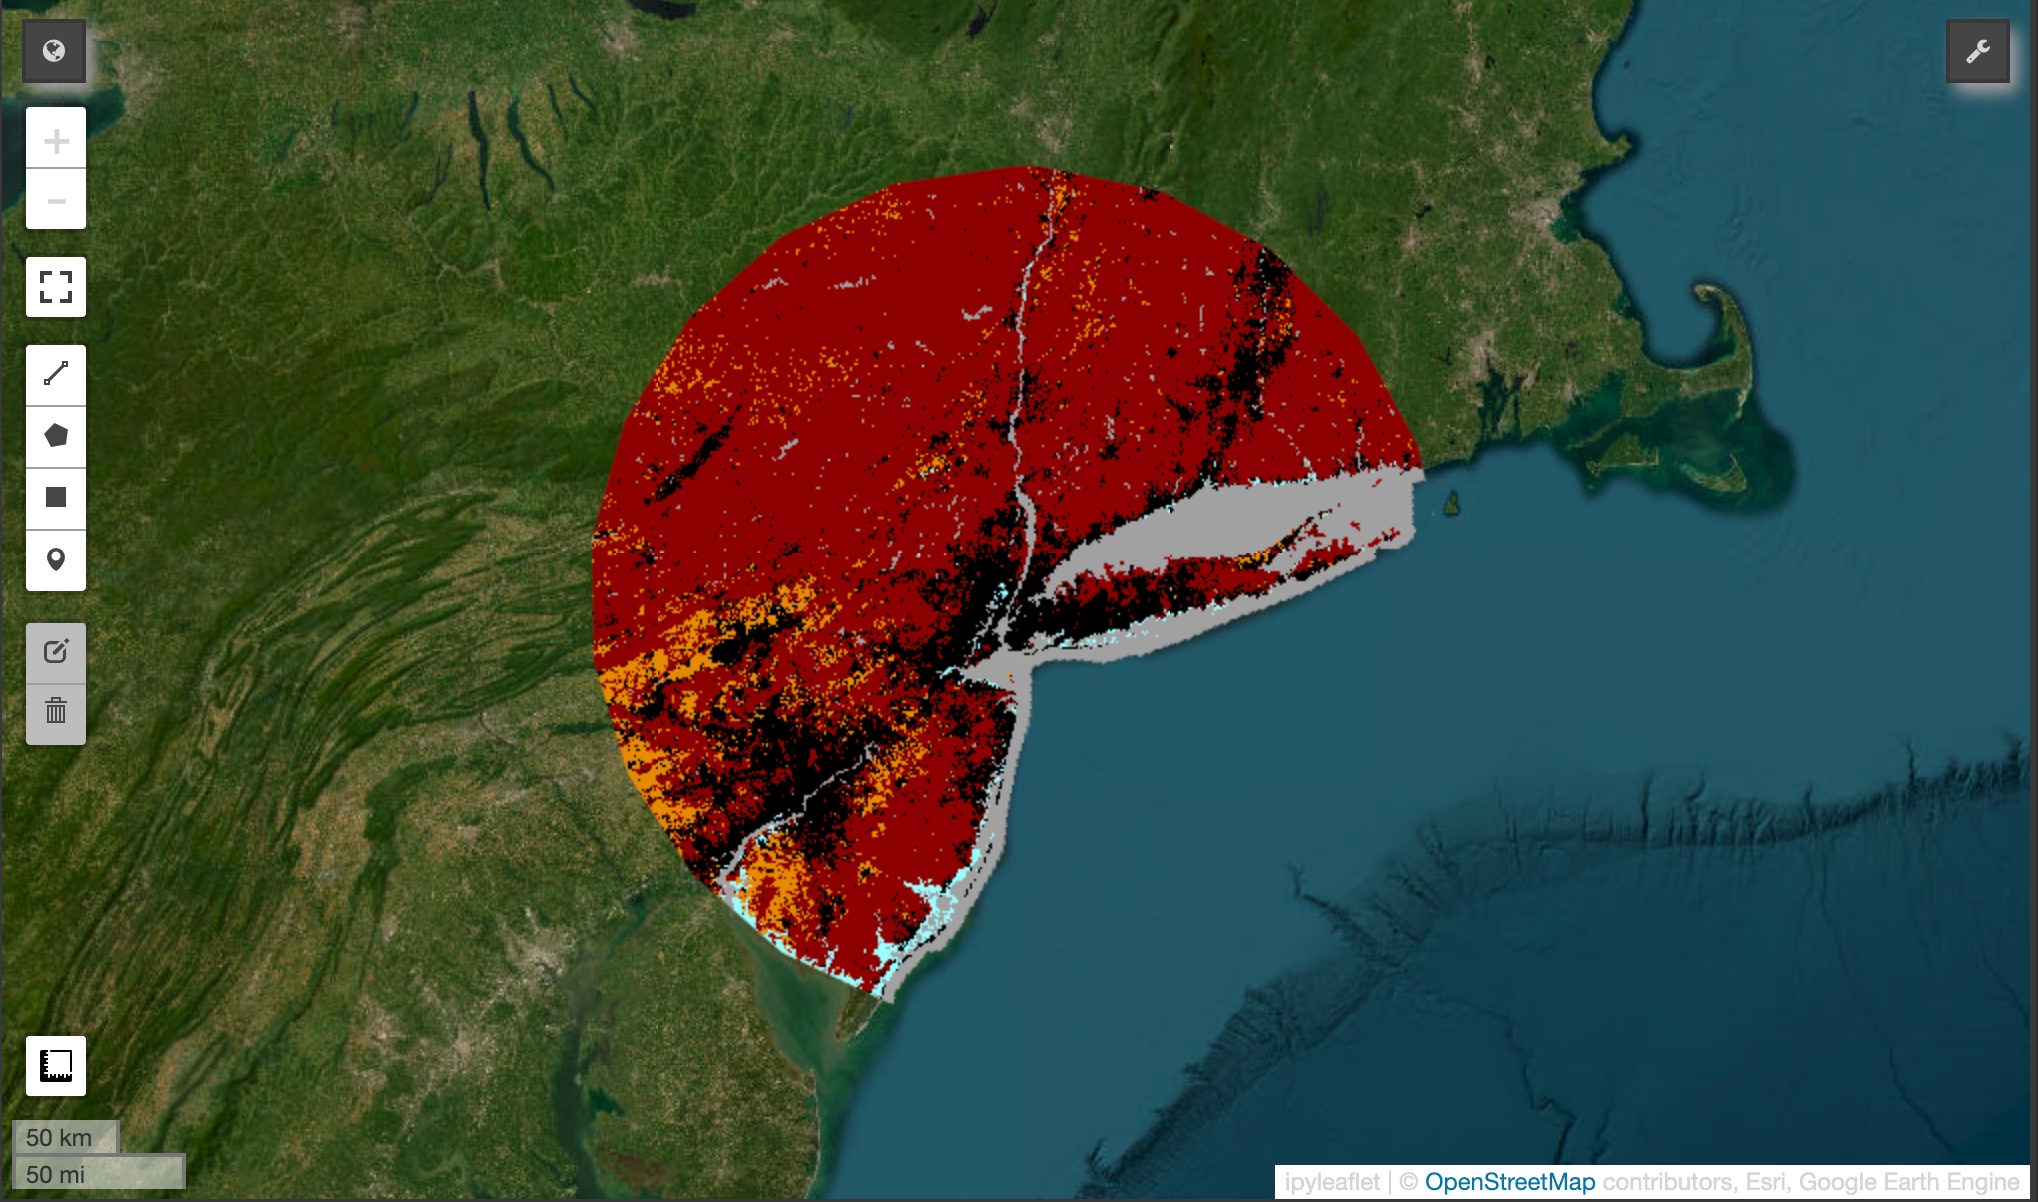
What if Australian Bushfires occurred in New York?
Making the Bushfires relatable to citizens of New York.
bands = [3]
nyc = (-73.968285, 40.785091)
aus_cover = 59000

USLandCover().simulate(bands, aus_cover, nyc)
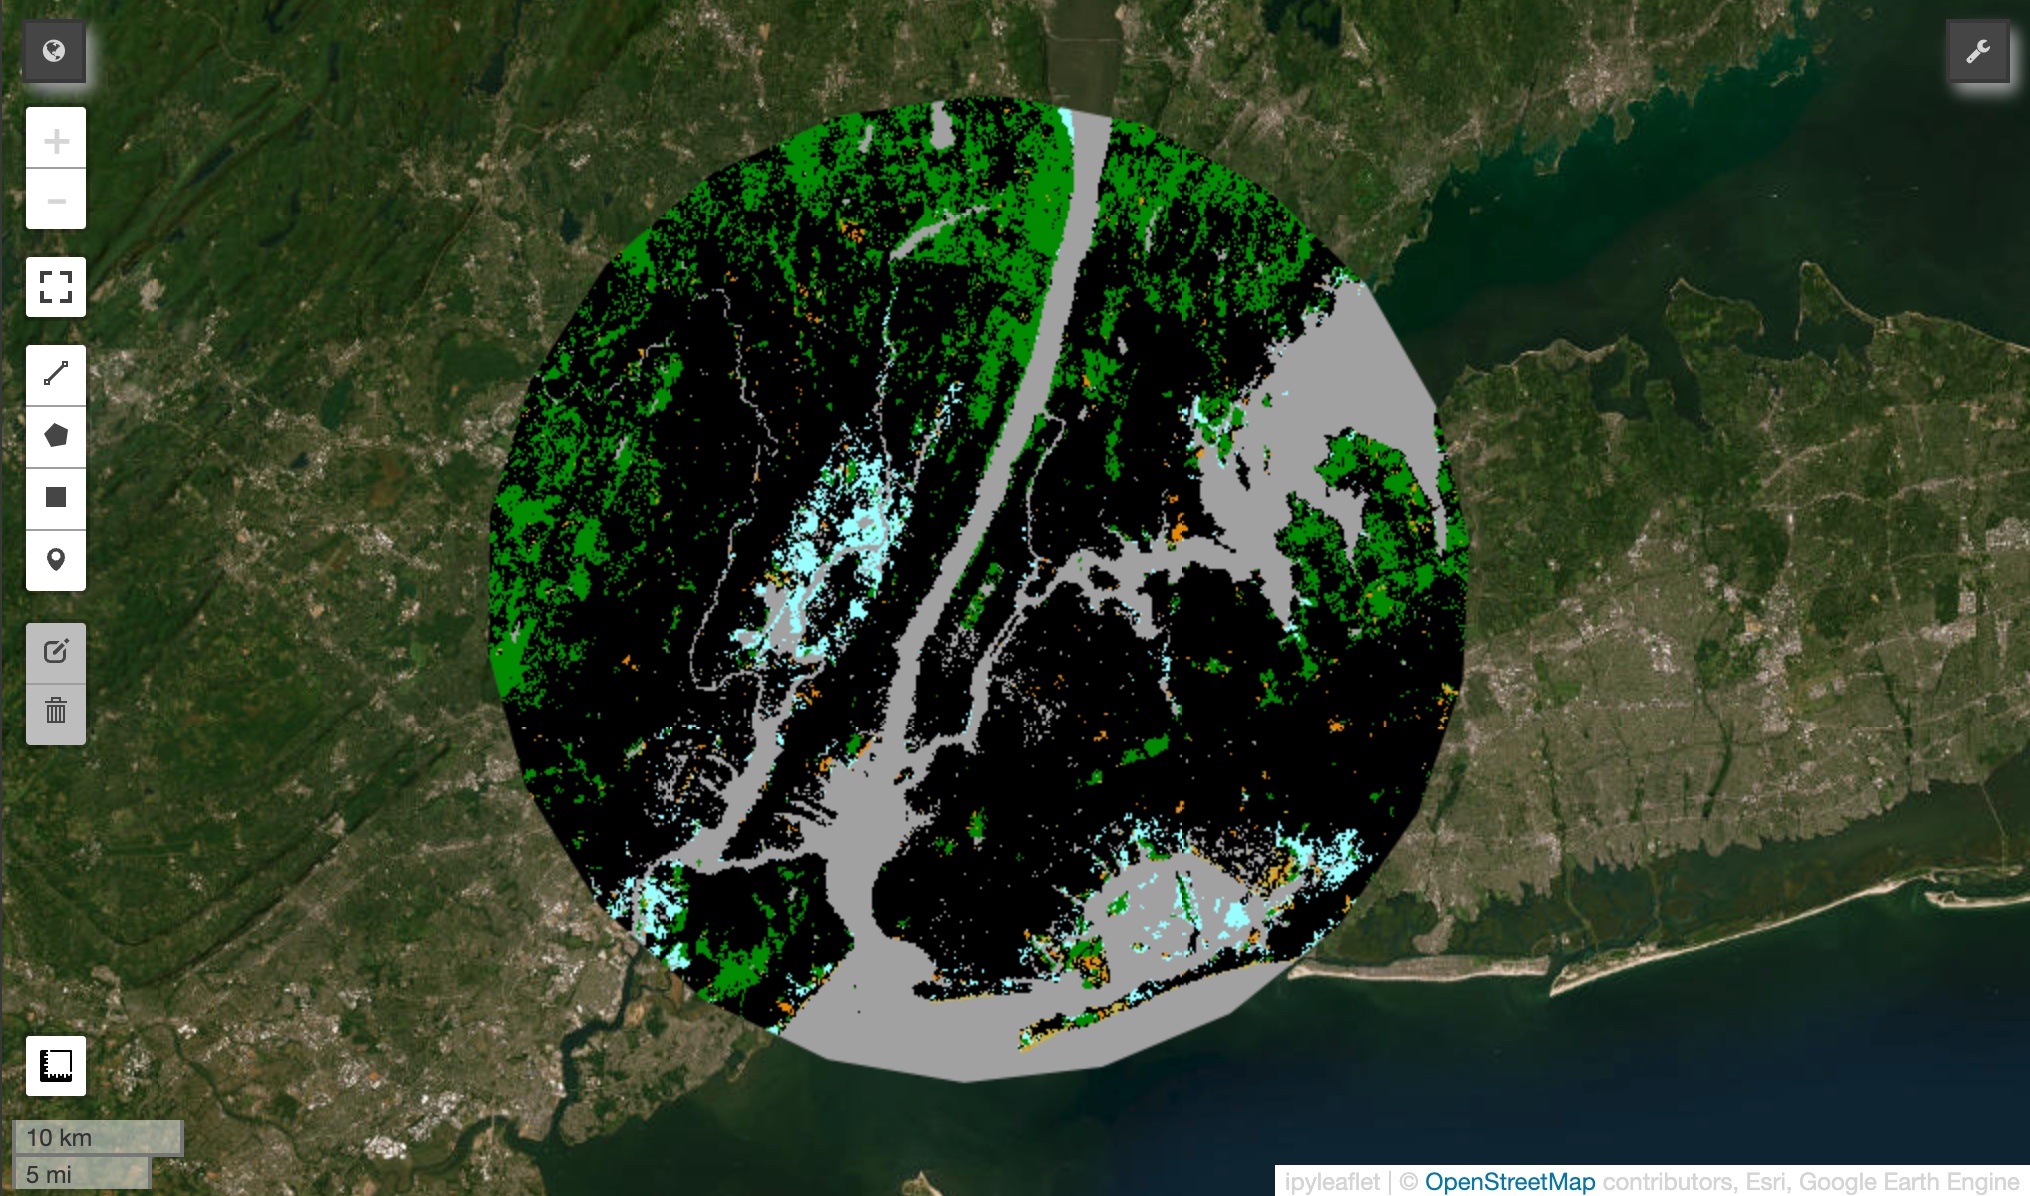
Extra MILE: Showing the number of trees the Team Trees planted.
bands = [3]
nyc = (-73.968285, 40.785091)
tt_cover = 244.95

USLandCover('008b00').simulate(bands, tt_cover, nyc)
TIME
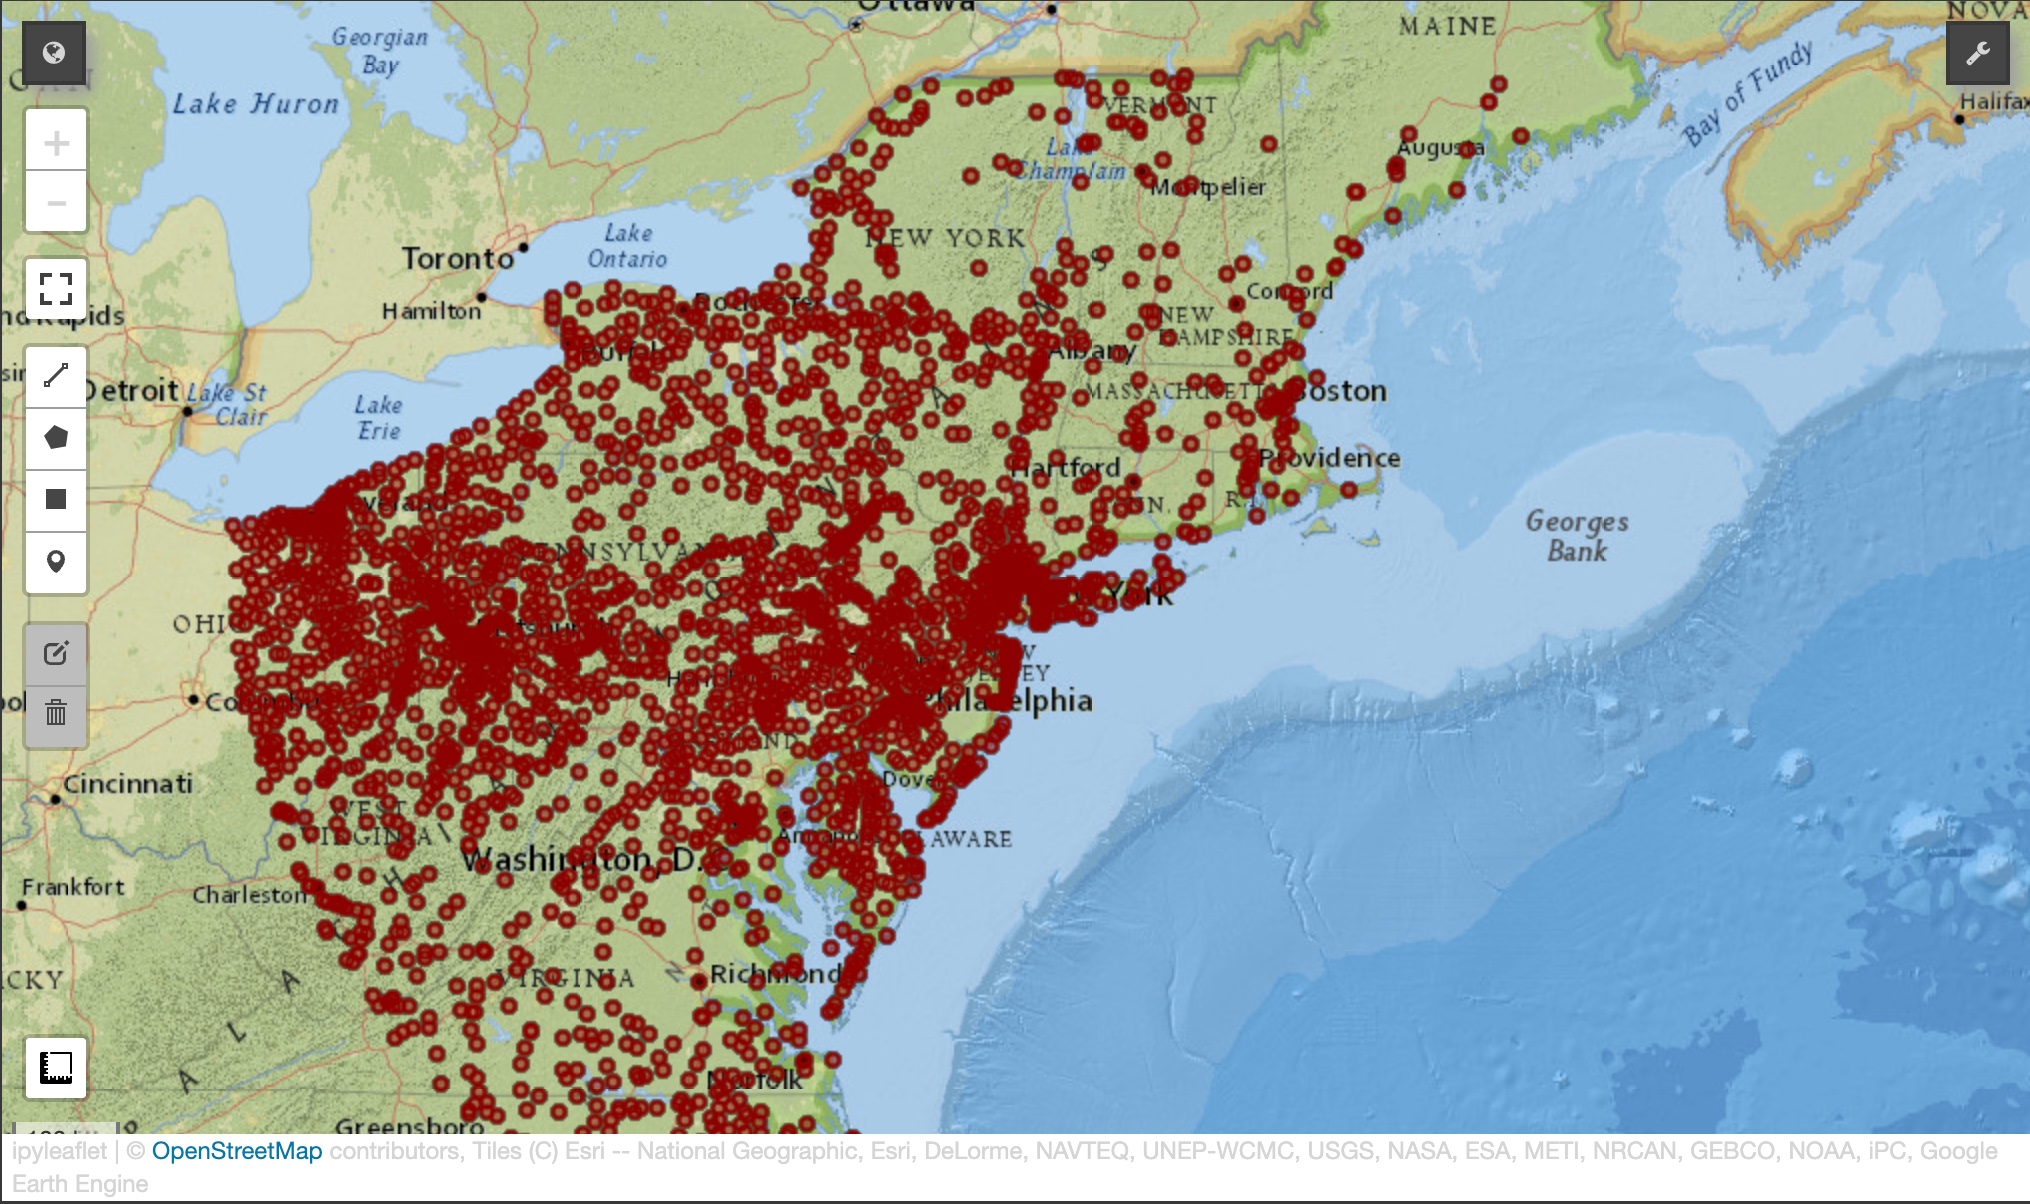
What if Spanish Plague re-emerged?
USPopulations().sim_plague()
REALITY
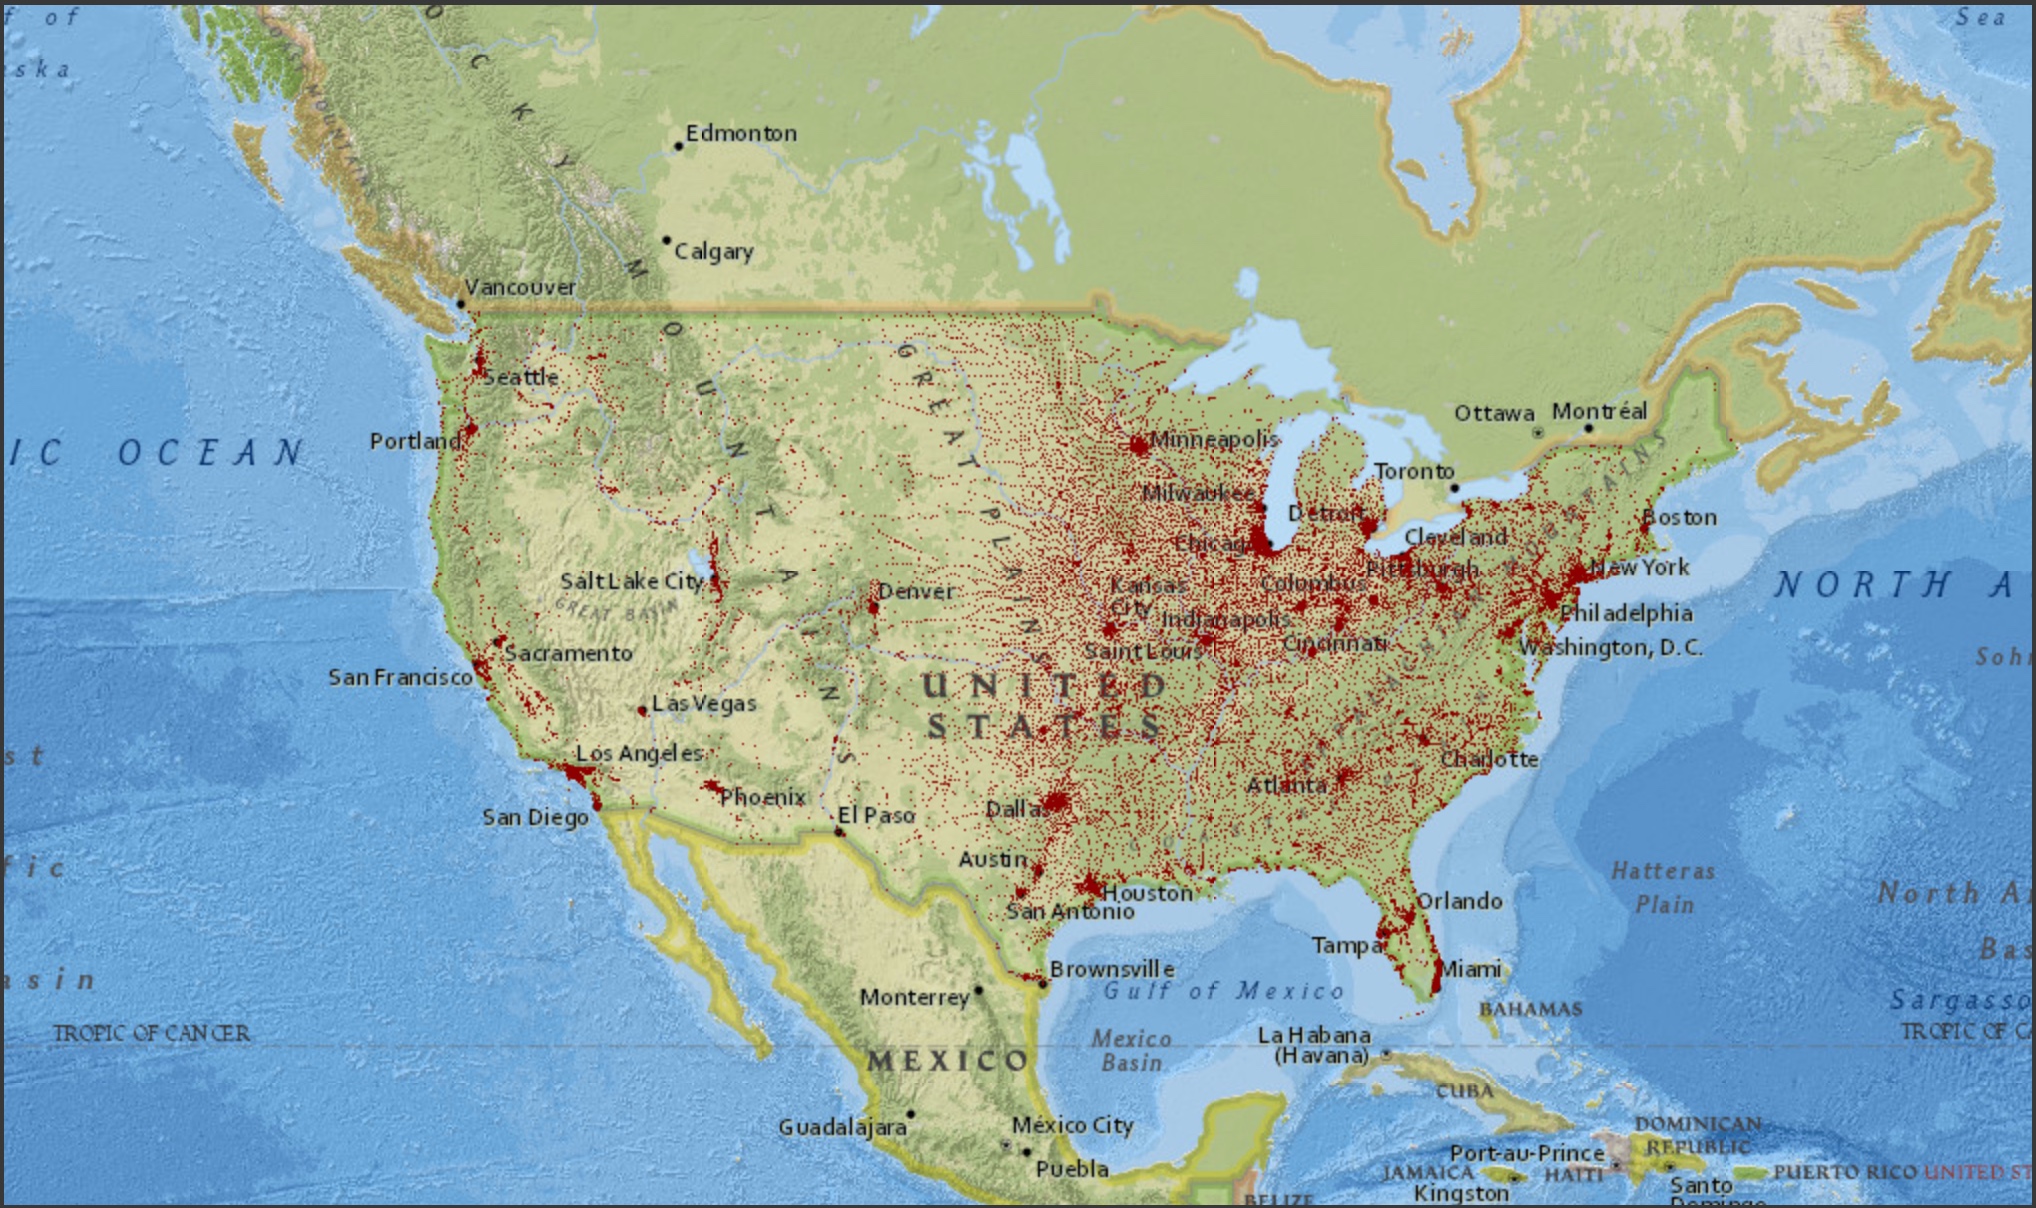
What if Genghis Khan sailed into the US?
nyc = (-73.968285, 40.785091)
gg_dt = 40000000

USPopulations().simulate(gg_dt, nyc)
GOOD STUFF
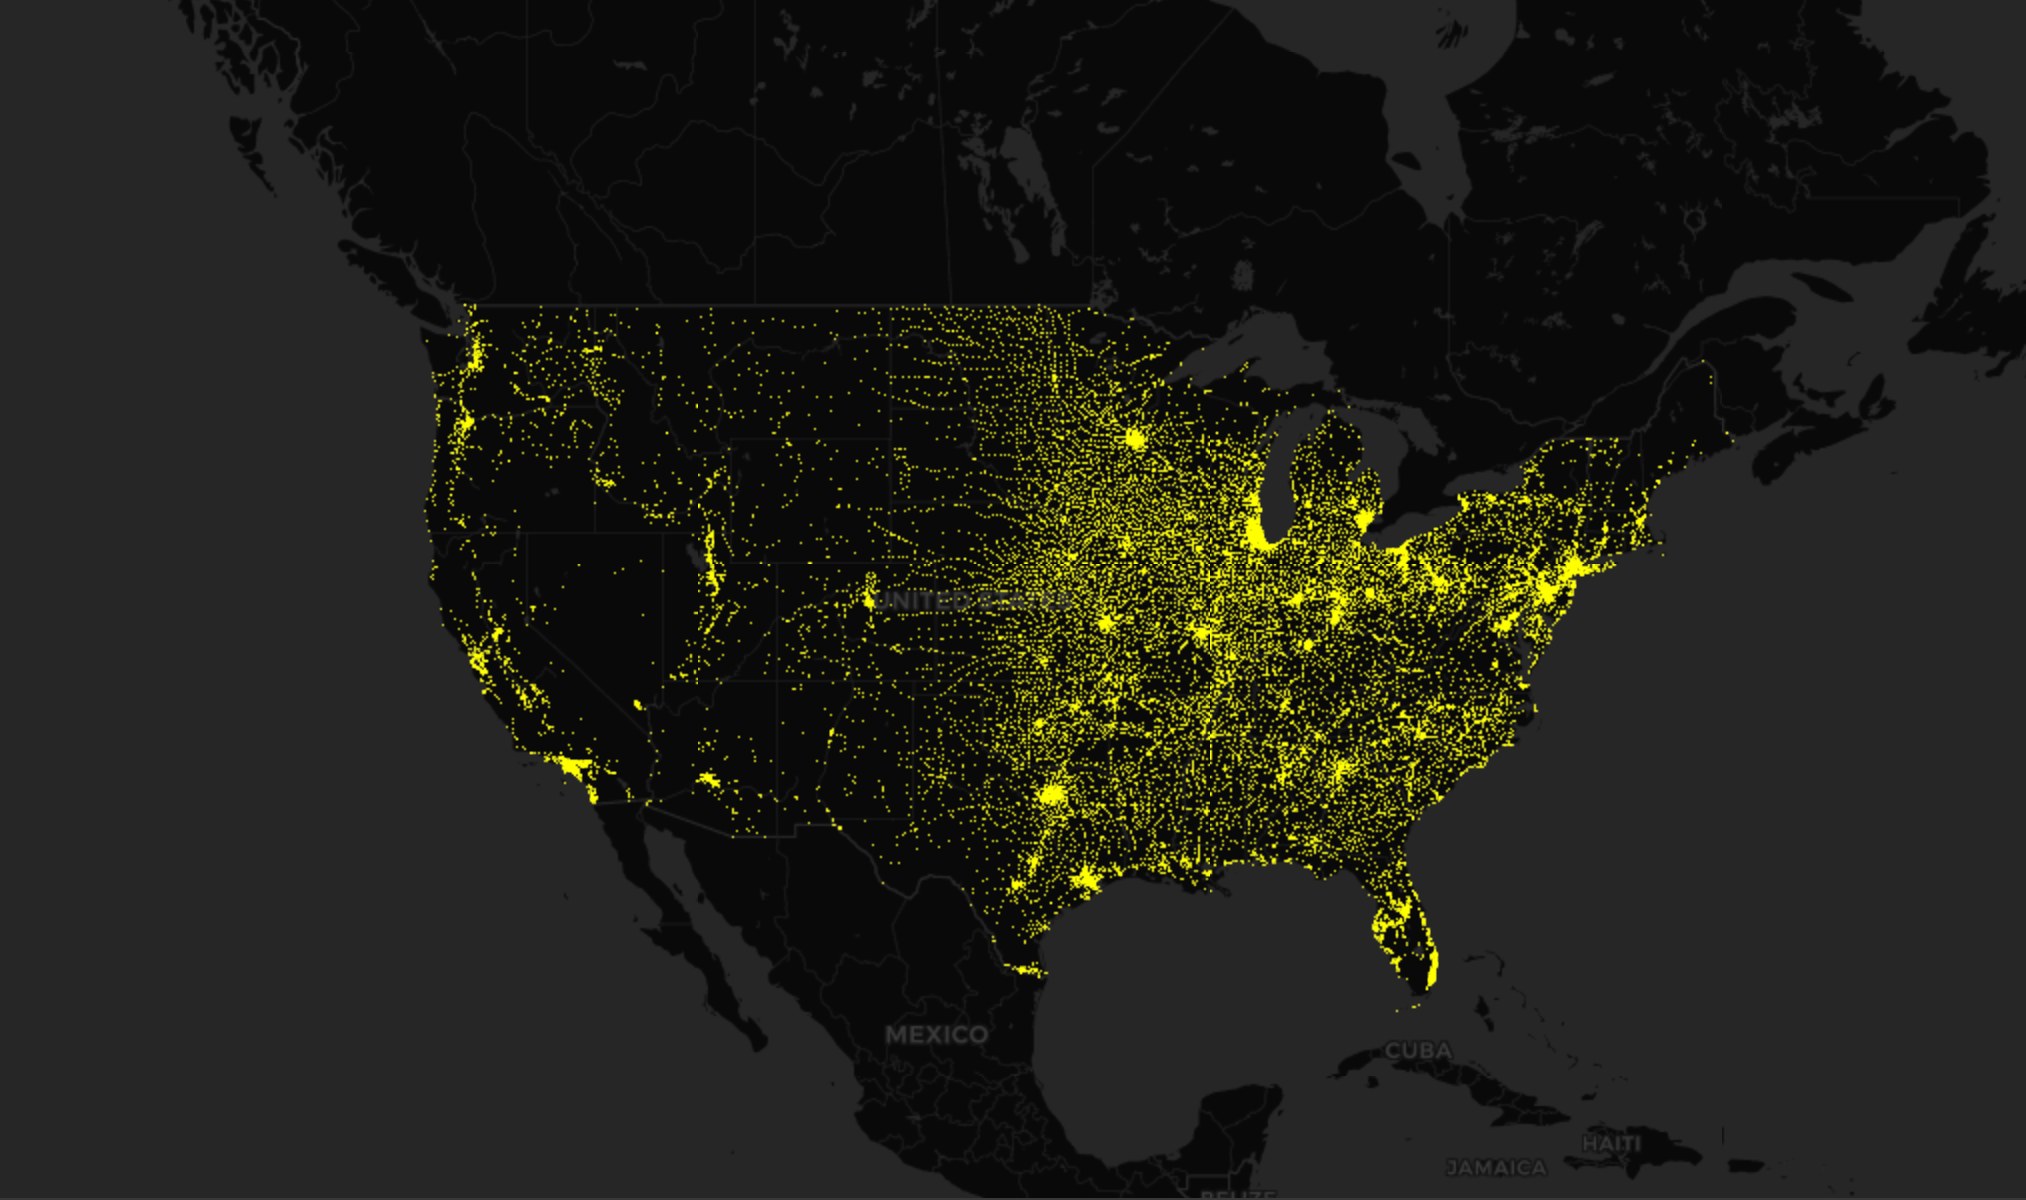
We can also showcase good things.What if Diwali was celebrated in the US?
up = USPopulations('FFFF00')
up.mep.add_basemap('CartoDB.DarkMatter')
up.sim_plague()
Credits
All the data are as latest as possible. The population data was released on Jul 2023, corresponding to 2022 closing populations.
Population Data: US Gov
Geemap Library: geemap